xG or expected goals is a data metric that has become increasingly popular and more important over recent years within the world of football.
Many FM players seem a little confused about it, so we’ve written this guide for xG so that you can get the most our of your team.
For those of you who love to drool over data, you’ll have been longing for this metric to be implemented into Football Manager for a while now, thanks to Sports Interactive for finally getting it in the game.
There are many different versions of the expected goals data model, but here in this guide we cover the core factors that make up xG.
What is xG in Football manager?
xG or expected goals is a metric used mainly by data analysts to understand the likelihood of a team’s shots being converted into goals.
There are lots of other stats in football that are “expected”, including expected assists for a particular player as an example.
Expected goals is a metric based on two key factors and lots of historic data.
To explain the maths simply, thousands of real life shots have been analysed over many seasons of football.
The shot locations have been plotted into specific areas of the pitch.
Each area has then been assigned a value. The value is a percentage that refers to the amount of shots that were taken in this area that ended up as goals on average.
See the below diagram to better understand…
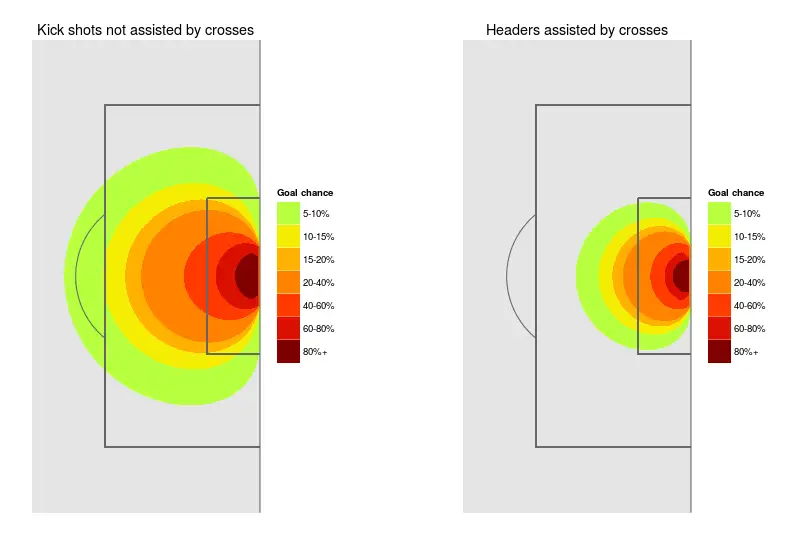
There are two factors that determine the expected goal value when taking a shot…
- Shot distance
The further away a player shoots from goal, the harder it becomes to score, for obvious reasons. Therefore, having closer shots to goal will give a higher xG value. - Shot angle
Having shots directly in front of goal will more than likely result in a goal than those taken from the sides of the goal at a smaller angle. Therefore, having shots in front of goal rather than from the sides will give a higher xG result.
You’ll notice that the quality of the striker and the quality of the defence isn’t taken into consideration.
So, once each shot has an xG assigned to it, we can simply add these up to create our team’s overall xG. This is the value you see on the main stat screen during a Football Manager match.
Why use xG in Football Manager?
It’s a really interesting stat to gather a quick understanding of whether your team are creating quality chances, as well as understanding how frail your team may be in defence.
In the past we usually saw the most basic of football stats, including total shots and total shots on target.
Whilst these are useful to know, we often don’t know the quality of those shots.
If a team had 20 shots on target, they could have all been taken from outside of the box, and perhaps the majority were easy saves for the keeper.
Each of these shots would result in a low xG, however if we combine them all, we may have a reasonable xG overall.
Just because a team is having lots of shots, it doesn’t mean they’re necessarily attacking productively with lots of high quality goal scoring opportunities.
In previous versions of Football Manager, we might choose to select “work the ball into the box” to try and reduce the amount of shots, but create better chances in general.
Alternatively, we’d choose to “shoot on site” in an attempt to use any chance we had to have a crack at scoring.
Now that we know our xG and our opponent’s xG, we can make better decisions and see whether our team has been unlucky during a game, or whether they’re simply not playing good enough.
Understanding Your xG Per Match
Here’s an example of how we can use xG in Football Manager to understand our team’s performance in one match.
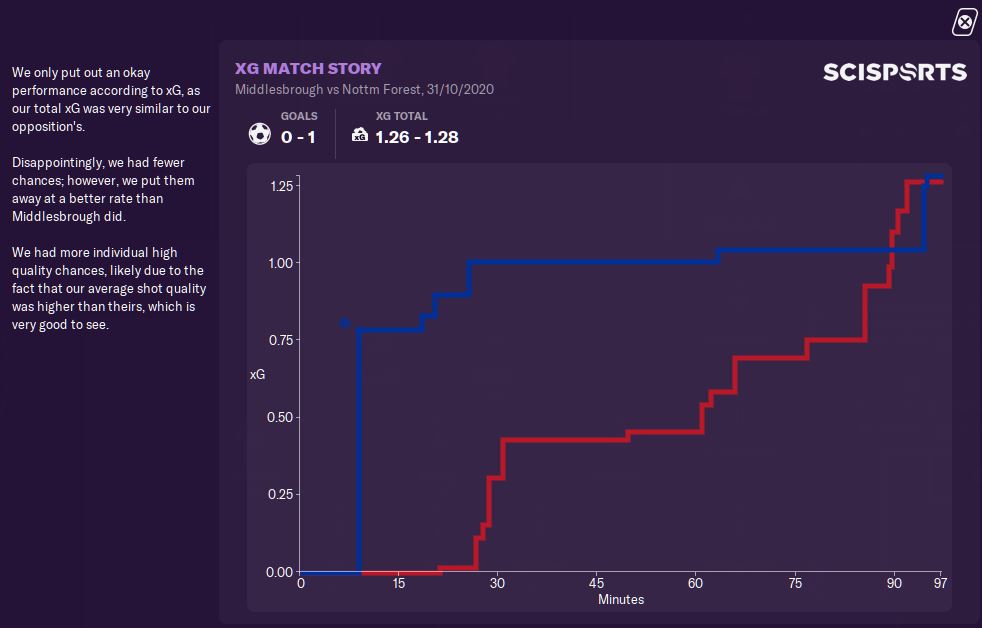
The first graph shows us when we’re adding to our xG throughout a match and highlights any goals that are scored too.
You can see that around the 7th minute, the blue line spikes with the goal icon just above it.
This highlights our penalty shot. Notice I said shot and not goal.
Even if Lewis Grabban missed the penalty, it would still have counted as around a 0.75 chance of scoring, so will be added to the overall xG for Nottingham Forest.
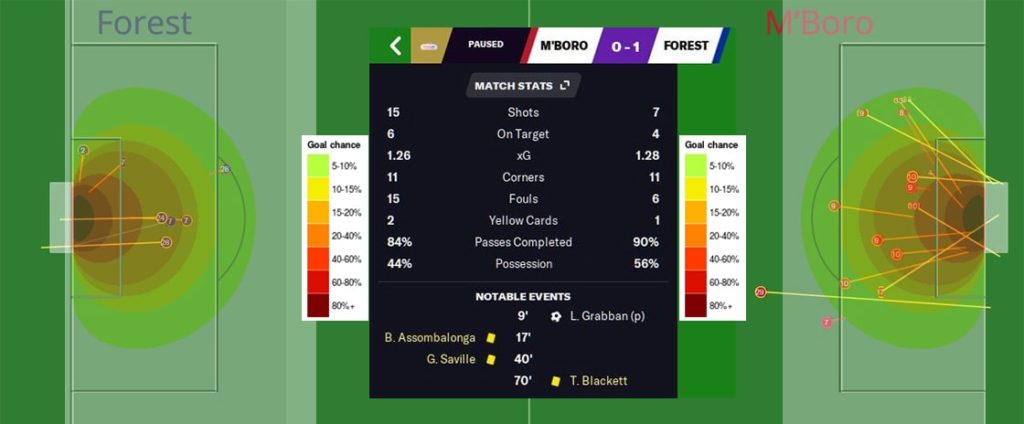
In the awful looking image I’ve added above, I’ve overlaid the xG heat map on top of the FM shot data for both teams.
This image shows why xG tells a better story than just looking at the shots stats.
In this match, Nottingham Forest had half the amount of shots that Middlesbrough did, yet both ended up with an almost identical xG.
This is because Forest had a penalty. Penalties tend to be converted about 75% of the time, so the xG would be 0.75.
The other few chances Forest had meant that their xG totalled up to 1.28. Statistically they should have scored one goal, which they did.
On the other hand, Middlesbrough had an xG of 1.26, meaning statistically they should have scored at least one goal, and therefore were unlucky with the chances they had, scoring none.
Perhaps their striker was having a bad day at the office.
It’s a concern for the Forest manager that there weren’t many good chances created during this game, and that the penalty and unfortunate shooting of Middlesbrough got them the win.
The xG stat helps us considerably with understanding both our attacking effectiveness and defensive structure in a match.
Understanding Your xG Throughout The Season
So now you know about the xG per match.
Well, you’re also able to find xG for your matches combined together to get a bigger picture over the course of a few games to add more data into your xG.
The more data you have, the more accurate the xG value will become.
It’s pretty useful to keep an eye on it throughout the season to help you make transfer decisions and understand how lucky or unlucky your team may be.
Where To Find The xG Stat in FM
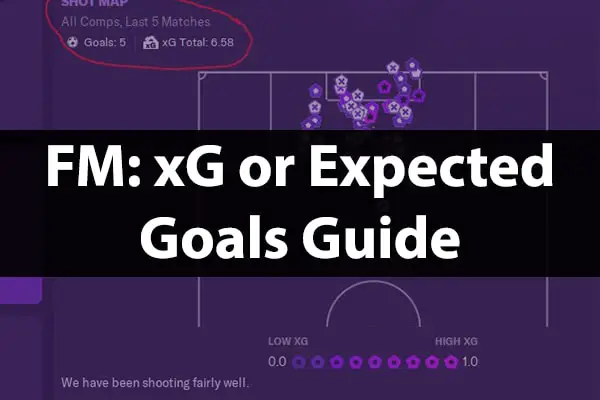
To find your xG or expected goals in Football Manager, select the Team Report menu item on the left side of the screen, then select the Analyst Report tab from the row of options along the top.
If you then select the Scoring section, you can find your team’s shot map in all competitions over the last 5 games, as well as the total xG for those games and the actual amount of goals your team scored.
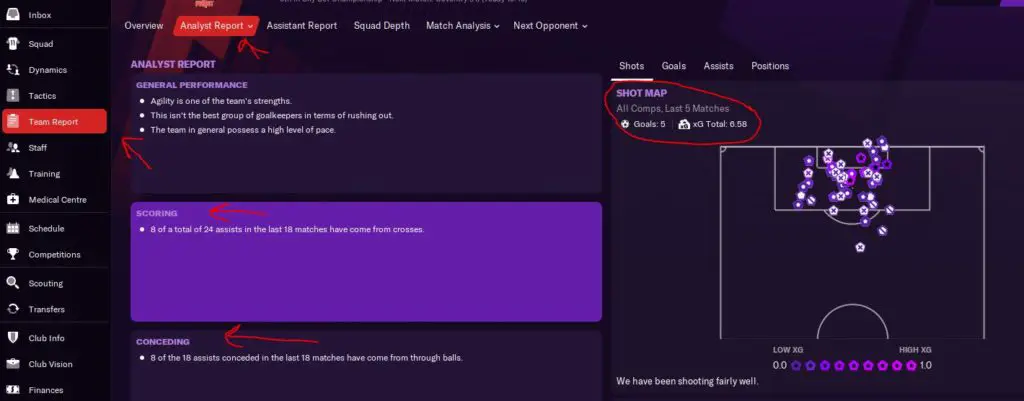
You can also select the Conceding section to see how well you’re doing defensively.
Have your team been very lucky defending recently and are on the edge of crumbling at the back, or have you built a fortress?
If you want to look at the xG per match, go to the Schedule menu item on the left side, then select a match and click View Match in the bottom right.
Once the match report has generated you should be able to see a Analytical Data button which will display all the xG data you need.
More on xG
Remember xG is just a guide and not a forecast, it works entirely based on historical data.
I’d recommend trying to find out more on xG and have a look at some real life examples, perhaps have a search for your favourite league’s xG data.
There’s lots of great work being done in the football data community. Check out blogs by Statsbomb on xG too for some real in depth analysis that you can use to help your FM team play better too!